There is a lot of public statistics available, but few include spatial information for statistics that are grouped into regions. This post shows how to visualize regional statistics in Spatial Studio.
Visualise regional statistics on a map using Spatial Studio #JoelKallmanDay
Many countries have a national statistical institute that collects data on whatever can be counted or measured in order to produce official statistics. Obviously this is important for politicians to use and abuse when they make their decisions. In Norway data.norge.no is a portal with a large collection of datasets from many sources. Statistics Norway (SSB) as you may expect has data on almost everything about the population and what is going on in our kingdom. You can explore Statbank Norway and dive into thousands of tables1. These statistics are usually grouped by kommune (municipality) or by fylke (county). At the moment there are 357 municipalities and 15 counties.
Unless you have extraordinary skills the data in these tables are not easy to visualize without using a tool or some code of your own. You can do the same in Python or other environments, but here I’m using Oracle Spatial Studio. Problem is that without any spatial information it is not directly possible to show them on a map.
The solution is to import datasets with these regions together with their spatial bounderies and then create a view that joins the region table with the stats table. In Norway every municipality has a unique key called kommunenummer and all statistics seems to include it, making it easy to join. If you don’t want to create this view yourself you can actually have Spatial Studio do this for you.
The site kart.ssb.no has several spatial enriched datasets, including administrative units for Norway. If you look for similar data for your country, make sure that the spatial projection is latitude/longitude. I find it easy to import GeoJSON into Spatial Studio from a local file, see previous post . Spatial Studio expects the spatial data to be in latitude/longitude format (like SRID 4326), but some mapping authorities offer various projections that Spatial Studio does not support.2
First test after import of the region tables is to display them and make sure it looks right:
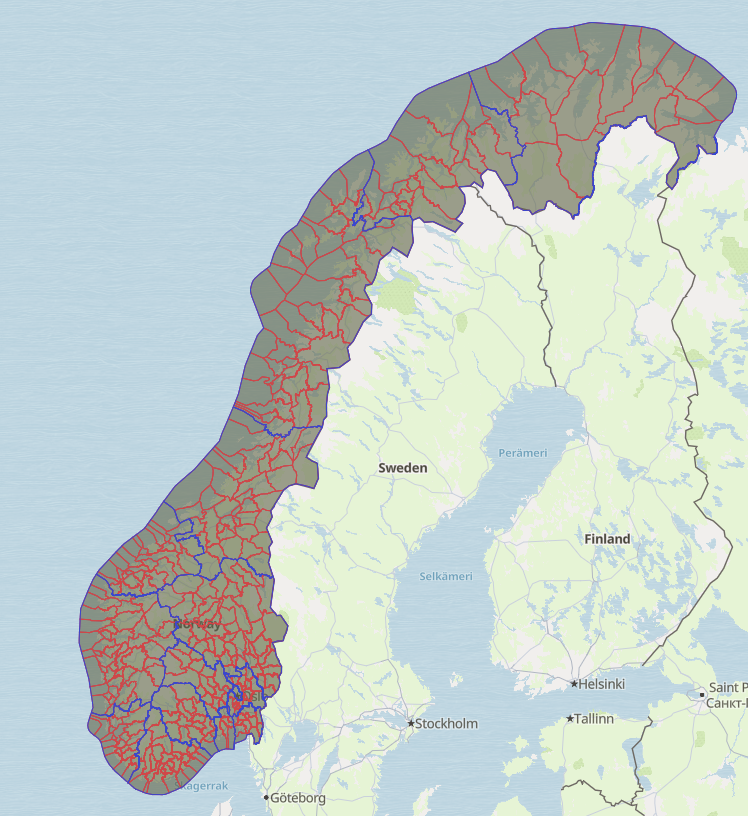
The area of municipalities and counties along the coast stretches out to the maritime boundaries making the shape look a bit unusual.
At Statistics Norway I found some stats on kindergarten (2025); what share (%) of the population aged 1 to 5 years are in a kindergarten, and what share (%) of those kindergartens are public owned. Downloading data as CSV and then importing it using SQL Developer or Visual Studio Code with Oracle SQL Developer extension is pretty easy.
The stats table in this case has just three columns:
create table barnehageandel(
    kommunenummer varchar2(5 byte),
    andel_barnehage_1_5_2025 number(38,10),
    andel_kommunale_barnehager" number(38,10)
   );
Join non-spatial data with spatial data using a view
From the region table for munipalities I am only interested in the key, name and geom column. Creating the view is simply:
create or replace view BARNEHAGEANDEL_geom as
select k.kommunenavn,k.kommunenummer,k.geom,
    b.ANDEL_BARNEHAGE_1_5_2025,b.ANDEL_KOMMUNALE_BARNEHAGER
from KOMMUNER k
    join BARNEHAGEANDEL b on k.KOMMUNENUMMER=b.KOMMUNENUMMER;
Next step is to add this view as a dataset to Spatial Studio. From the Datasets entry in the left menu, click on the Create dataset button, select Database table/view and then the connection to the database. As shown in previous post, Spatial Studio warns that a key column must be defined, in this case I use the kommunenummer column. The whole process is really easy.
Since the stats table has two measured statistics you can drag the dataset twice into the map and select different columns for Fill in the style configuration. Change the name of the layers in order to make it clear what the layer shows.
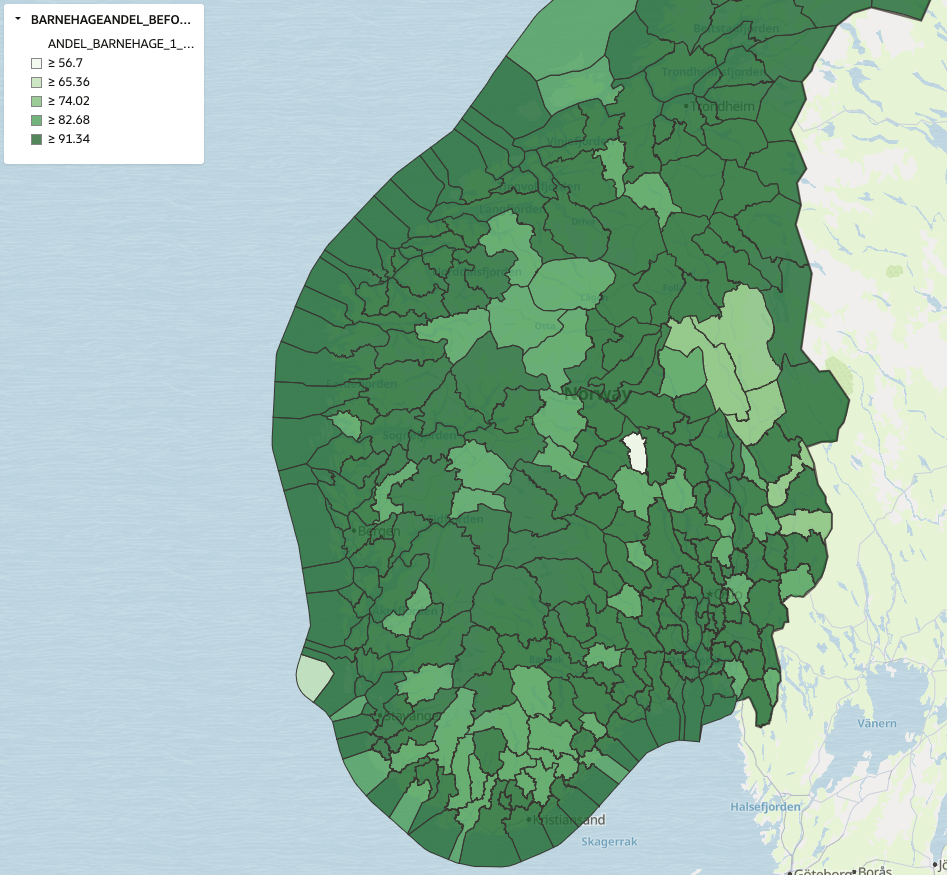
The following shows the percentage of the population aged 1 to 5 years that are in kindergarten3:
This one shows the percentage of those kindergartens that are public (kommunale):
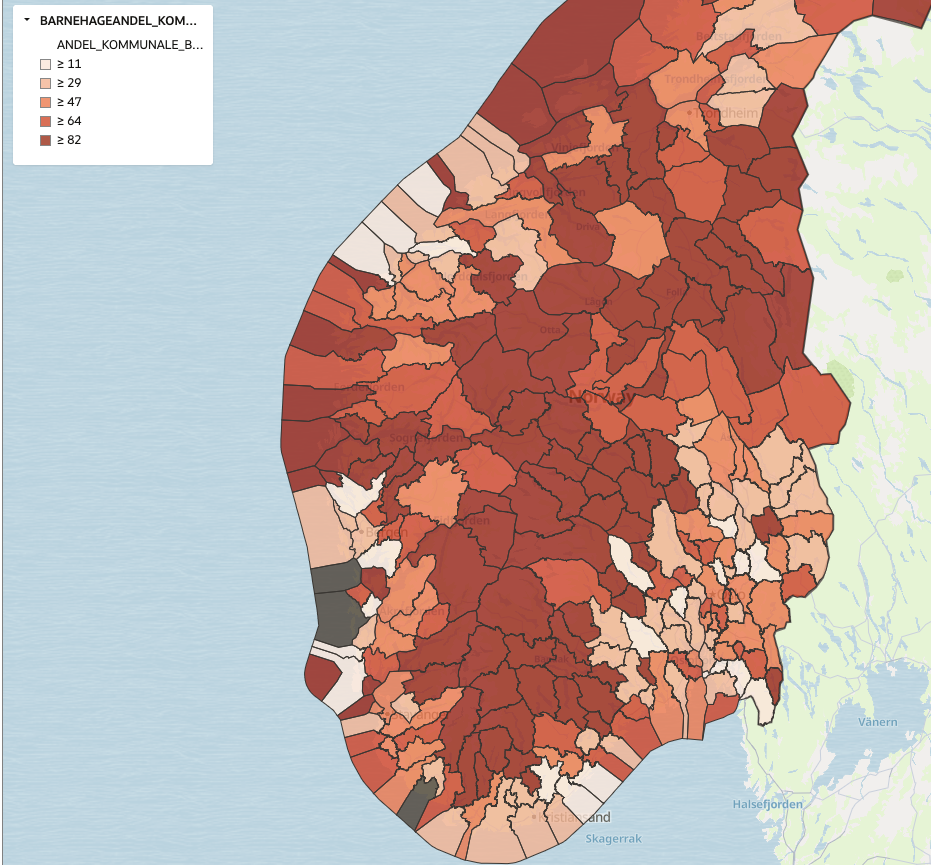
Slightly more interesting with more variations. Next step could be to get a dataset on what political parties govern these municipalities.
Join the non-spatial dataset with spatial dataset in Spatial Studio
You can have Spatial Studio join the non-spatial dataset with a spatial dataset for you. Just add the non-spatial dataset as any other dataset and define the unique key as always. Then it will inform you that preparation is required for mapping and spatial analysis:
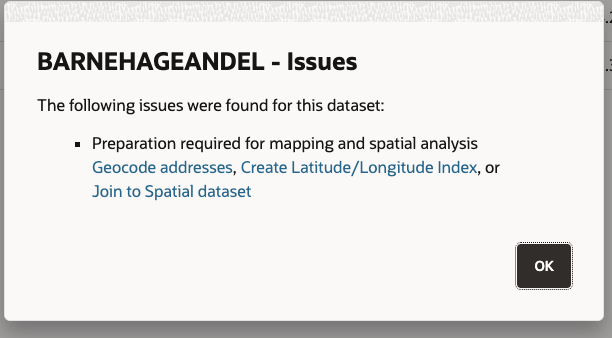
Click on the link Join to Spatial dataset. In the next window you select a spatial dataset and join-columns, also select columns you want to use further.
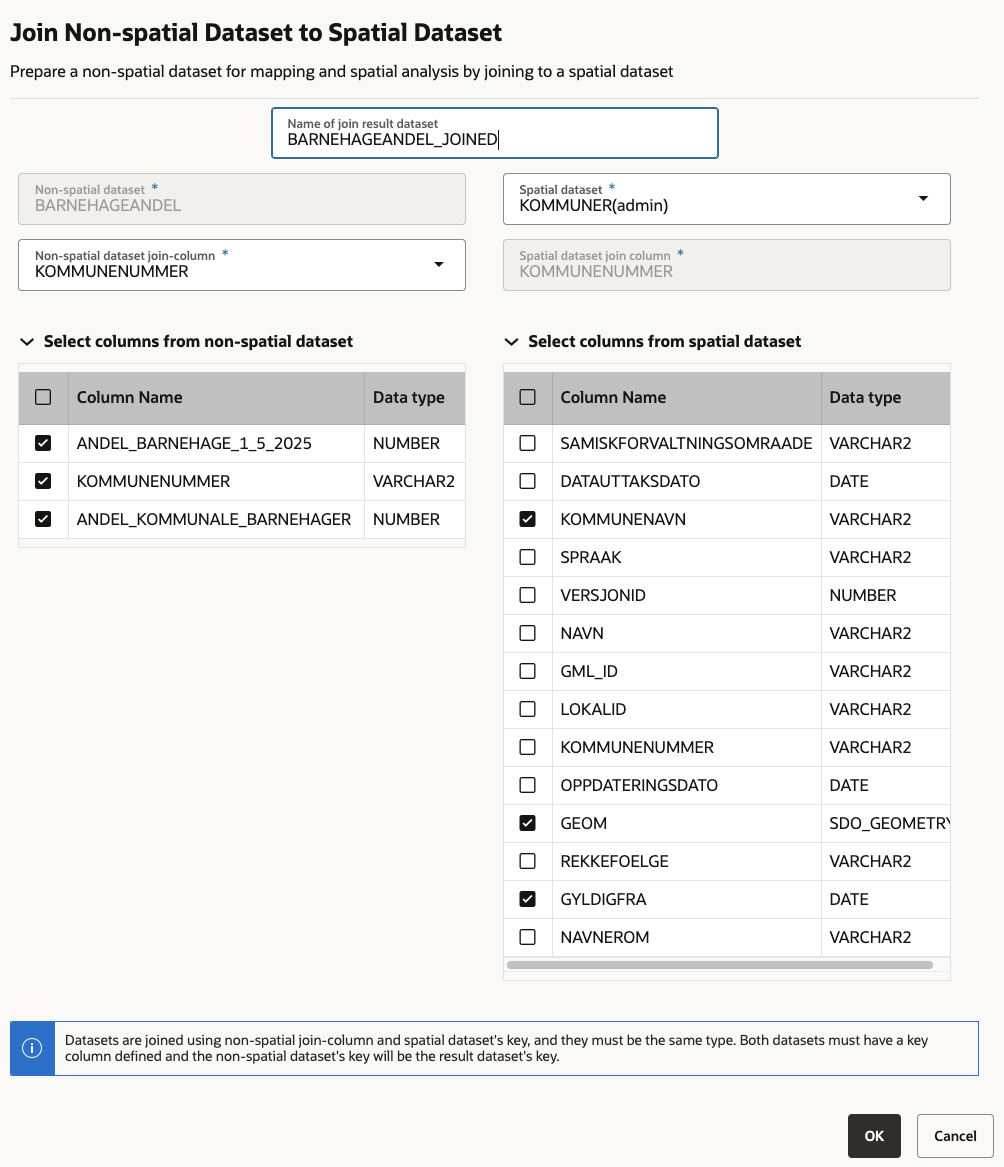
This will create a new dataset that can be displayed in a project.
You can use these techniques to visualise any dataset where the numbers are grouped by some region as long as you can get one dataset for the same regions that includes the boundaries in a supported spatial format.
Which method you prefer depends on your habits and workflow. Creating a view is easy, but keeping most of the workflow in the same tool reduces the mental friction.
What is #JoelKallmanDay?
See the announcement at oracle-base.com for an explanation and watch out for a long list of published post during and after October 14. My blogging activity is very unreliable to say the least. But every year I want to honor this tradition by writing a blog post with this special tag. Joel was an outstanding community person, he was always willing to help and inspired many people in the Oracle community around the world.
Random example: 12972: Bankruptcies, by region, week and weekday ↩︎
Another example is opendata.swiss that has a dataset on cantons , also in GeoJSON and EPSG/SRID 4326. ↩︎
I had to zoom in a bit to reveal some details, hope the Northerns won’t take any offence. ↩︎