Oracle Spatial Studio is a bit like a music studio. It is a place to explore things and get new ideas in the process. With this tool you can explore data on maps and discover new connections between various datasets. You don’t need a lot of data before a viualization becomes useful, especially for spatial data.
First session with Oracle Spatial Studio
With Spatial Studio it is easy to load, verify and visualize spatial data. Data you want to put on a map are often distributed in special format like GeoJSON and ESRI spatial files. I am not aware of any other simple tool that makes it easier to load this kind of data into the Oracle database.
This is a gentle introduction to get started. More advanced use will follow.
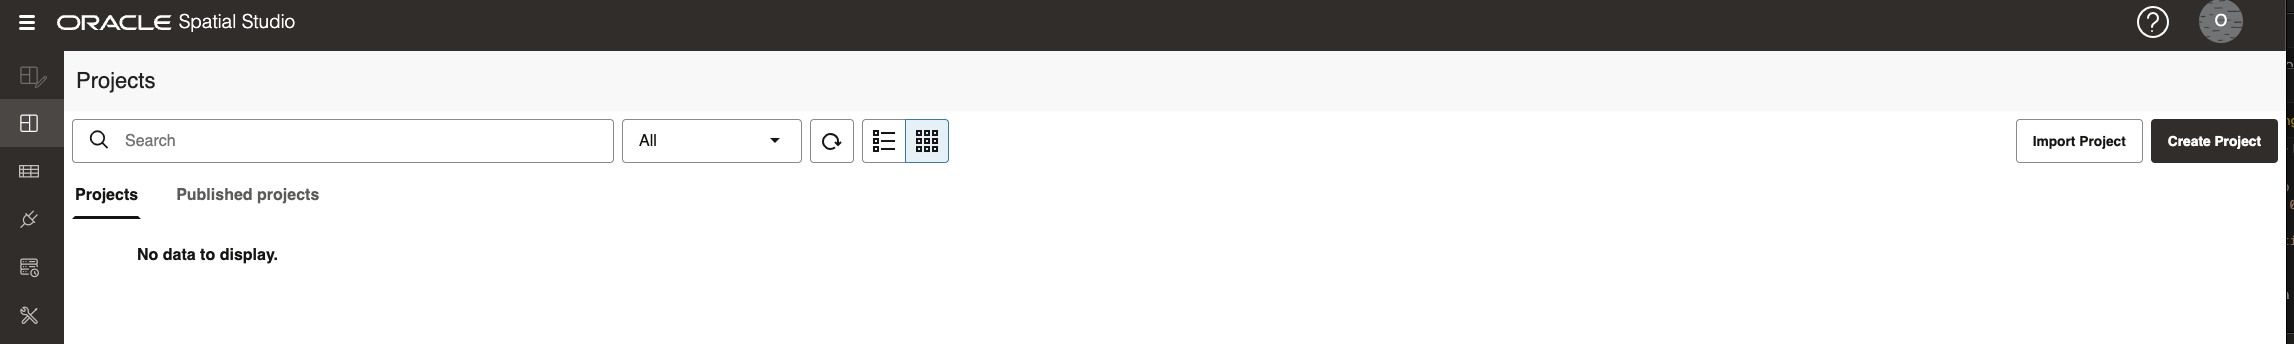
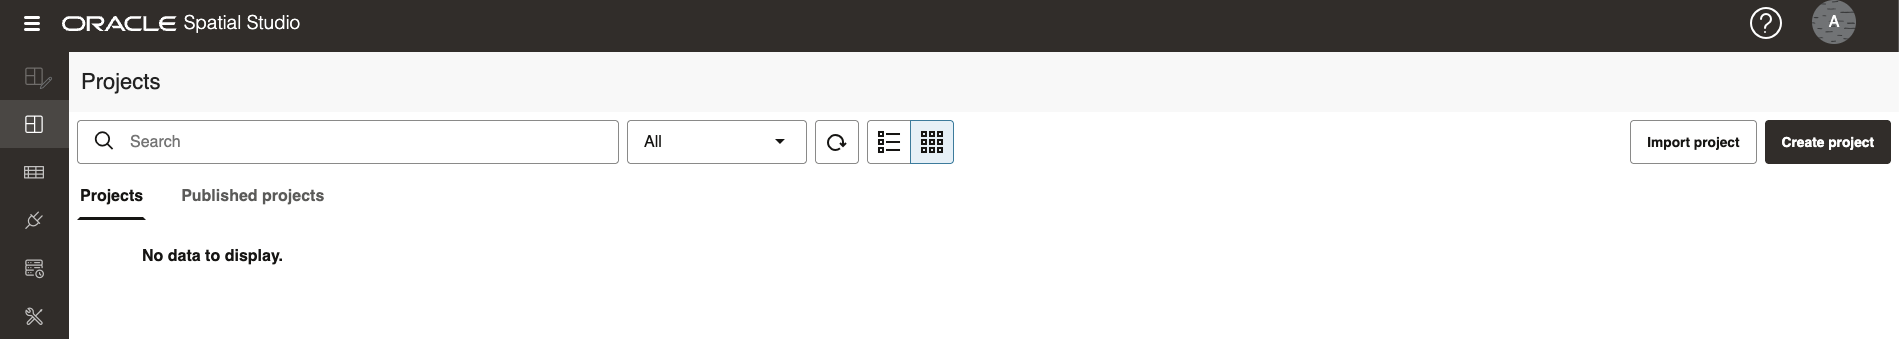
First time you log into Spatial Studio you will see a screen like this:
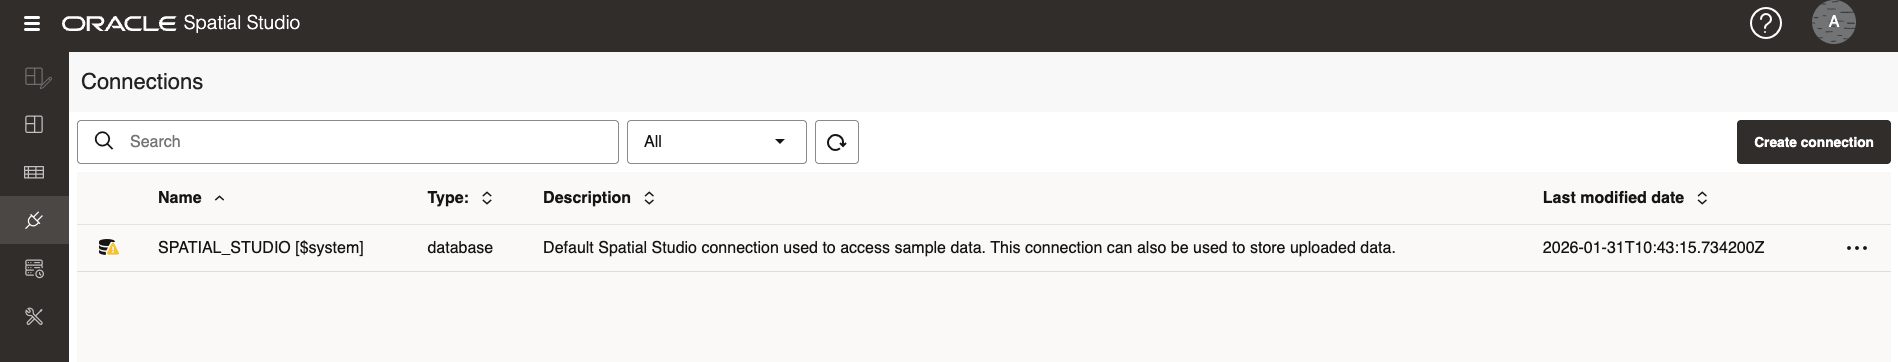
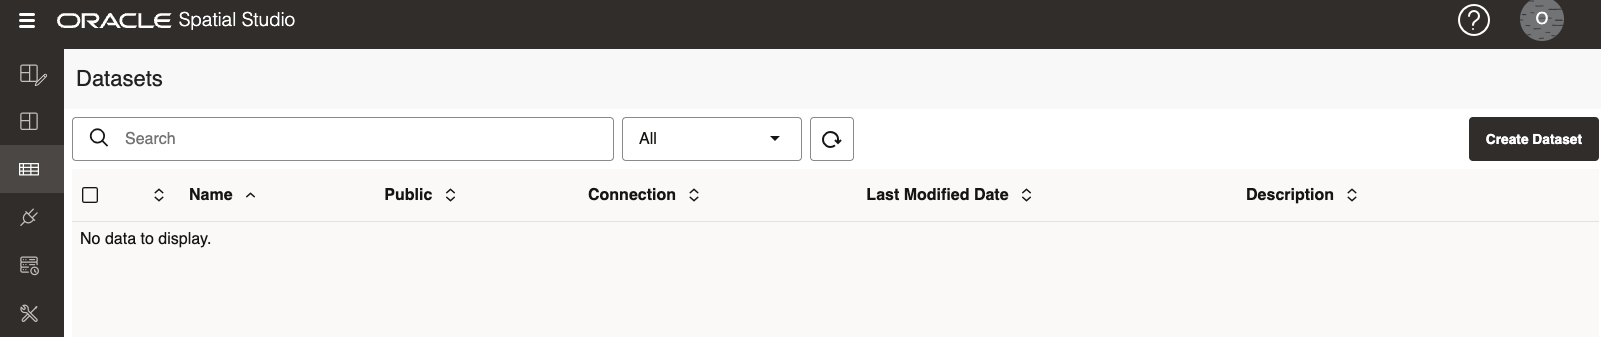
I have some data in an Oracle database, so I create a connection to it from the Connections page. You’ll see that the connection I created for the repository is listed:
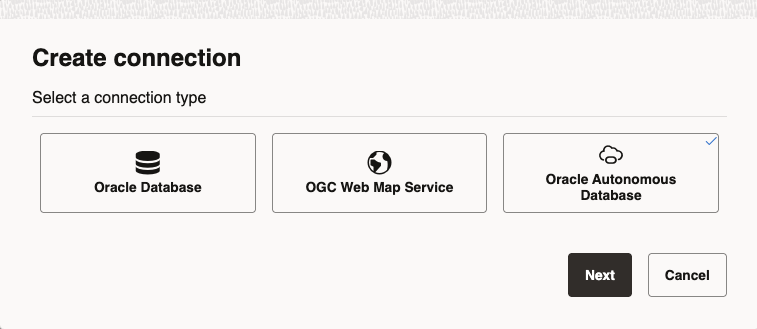
In this case the table is in an Autonomous Database:
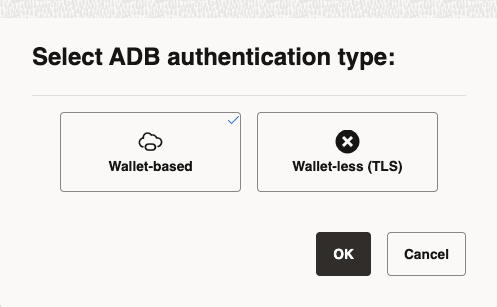
After clicking Next you must choose authentication type, I’m using the first, “Wallet-based*:
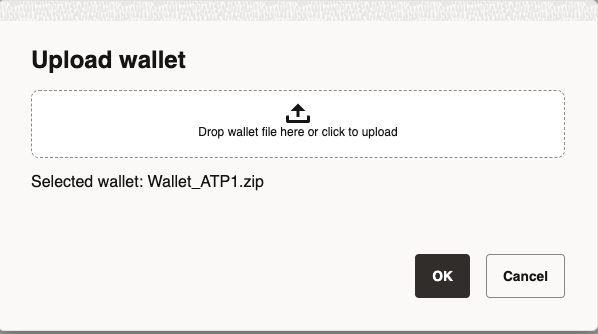
Drag the wallet into the area:
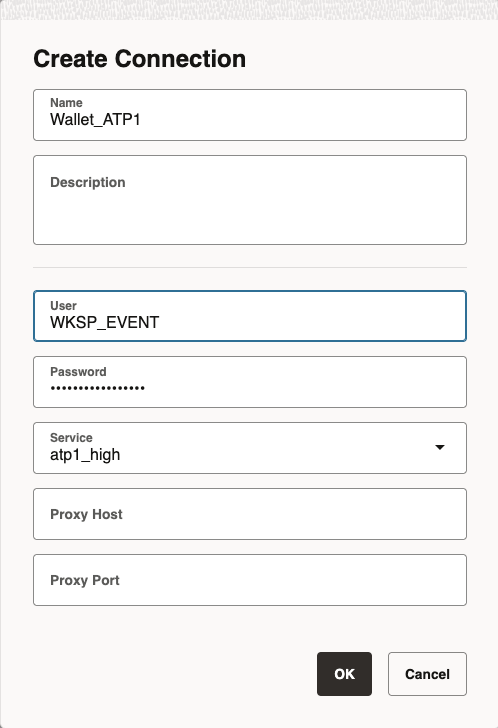
Add the connection details:
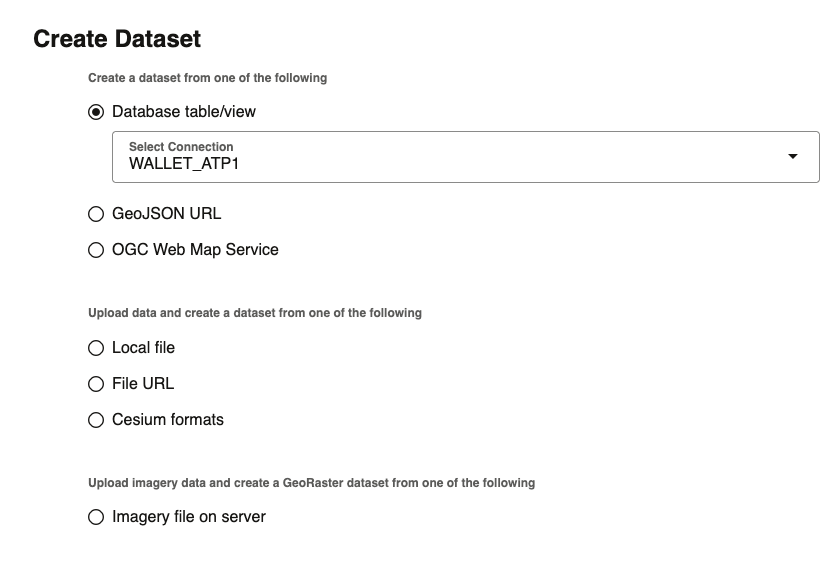
Now with a connection in place I create a dataset:
Here I select Database table/view from the connection I just created. You have other options here like loading data from files or from a URL.
I have one table with longitude and latitude in.
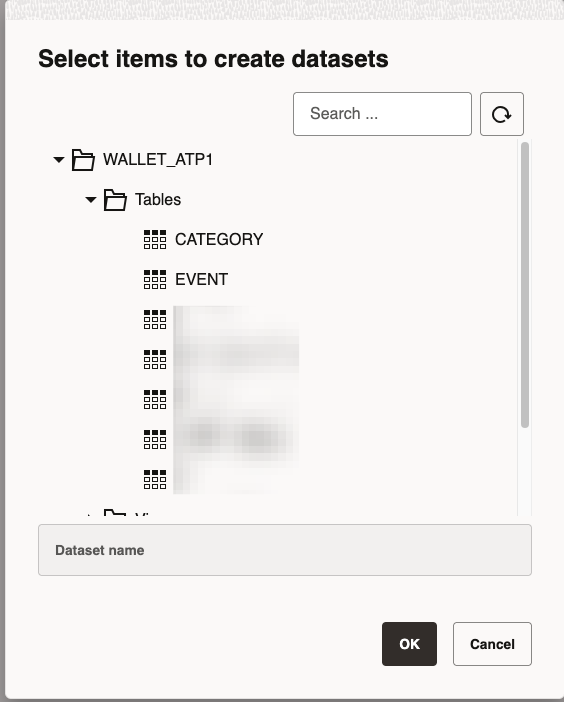
The icon besides the table shows there is an issue with it:
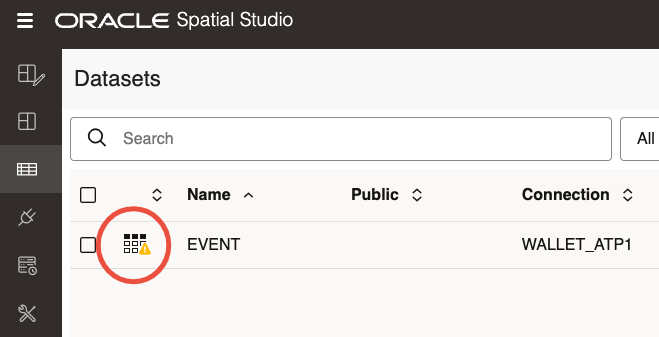
Click on the icon and offer you to fix it:
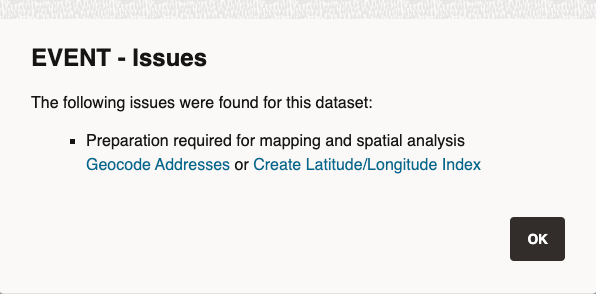
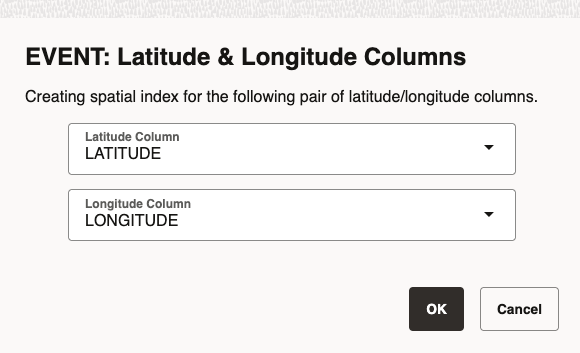
I clicked the Create Latitude/Longitude Index. The data comes from one of my silly APEX apps where my position is fetched from the mobile and stored in two columns, latitude and longitude1. Spatial Studio got it right at first attempt so I can just click OK:
By the way, next time I try to add a datasource from the same connection, the table will have another icon beside it:
If you do something similar check with SQL Developer or similar tool what has been created. My table now has a function-based domain index that uses a new function created in my schema called SGTECH_PTF. It takes longitude and latitude as arguments as retuns a point with datatype sdo_point_type. Very simple and easy.
Almost there; we can now start on a new project. Hit the tab for projects and create a new project:
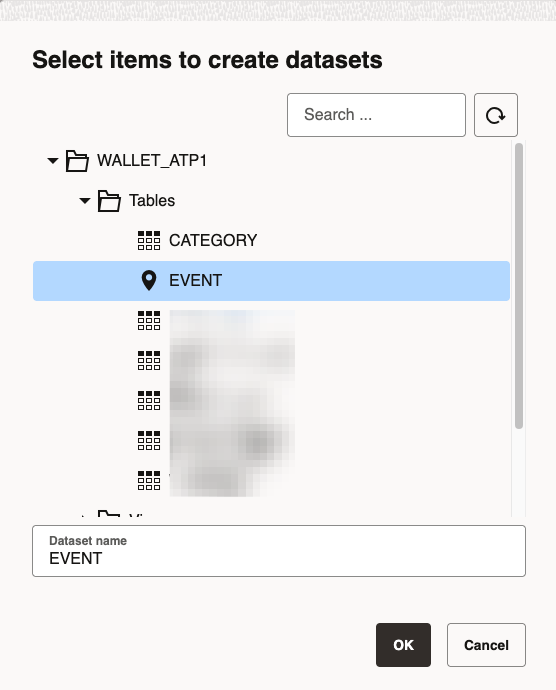
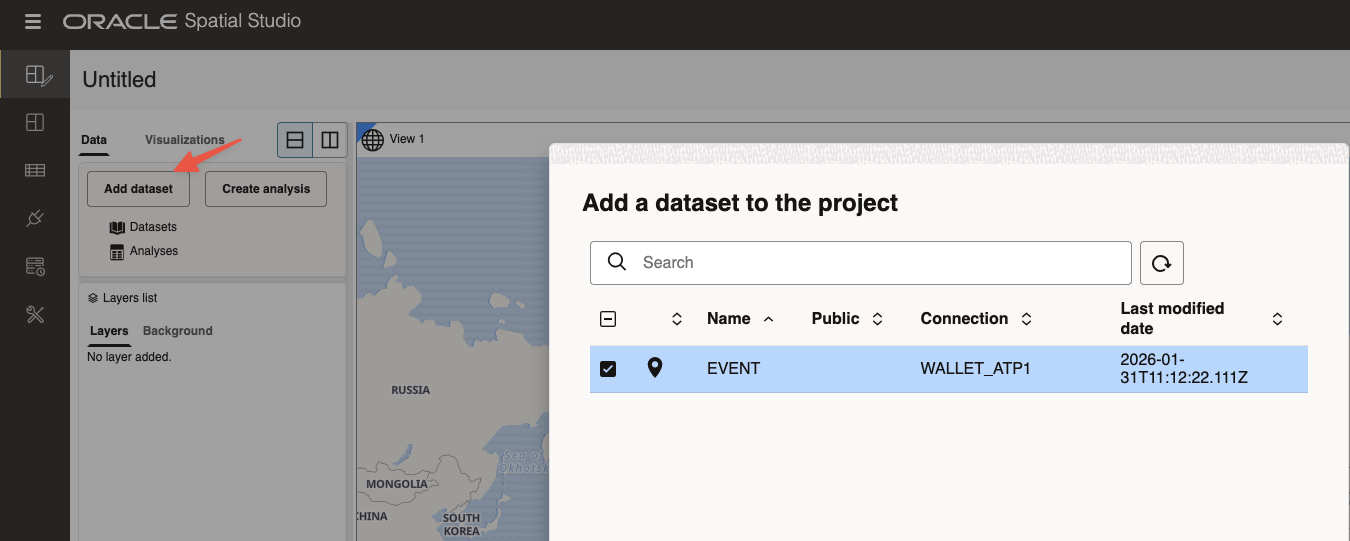
Then add the dataset from the Add Dataset button, select the only dataset we have so far, and then OK:
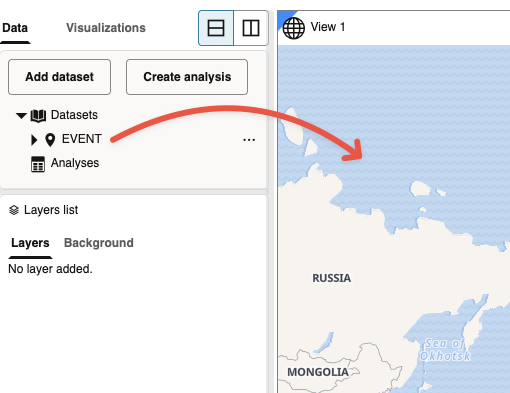
To show it on the map, click on the table name and drag it into the map.
I changed the default color so the points are more visible here, and zoomed in a bit:
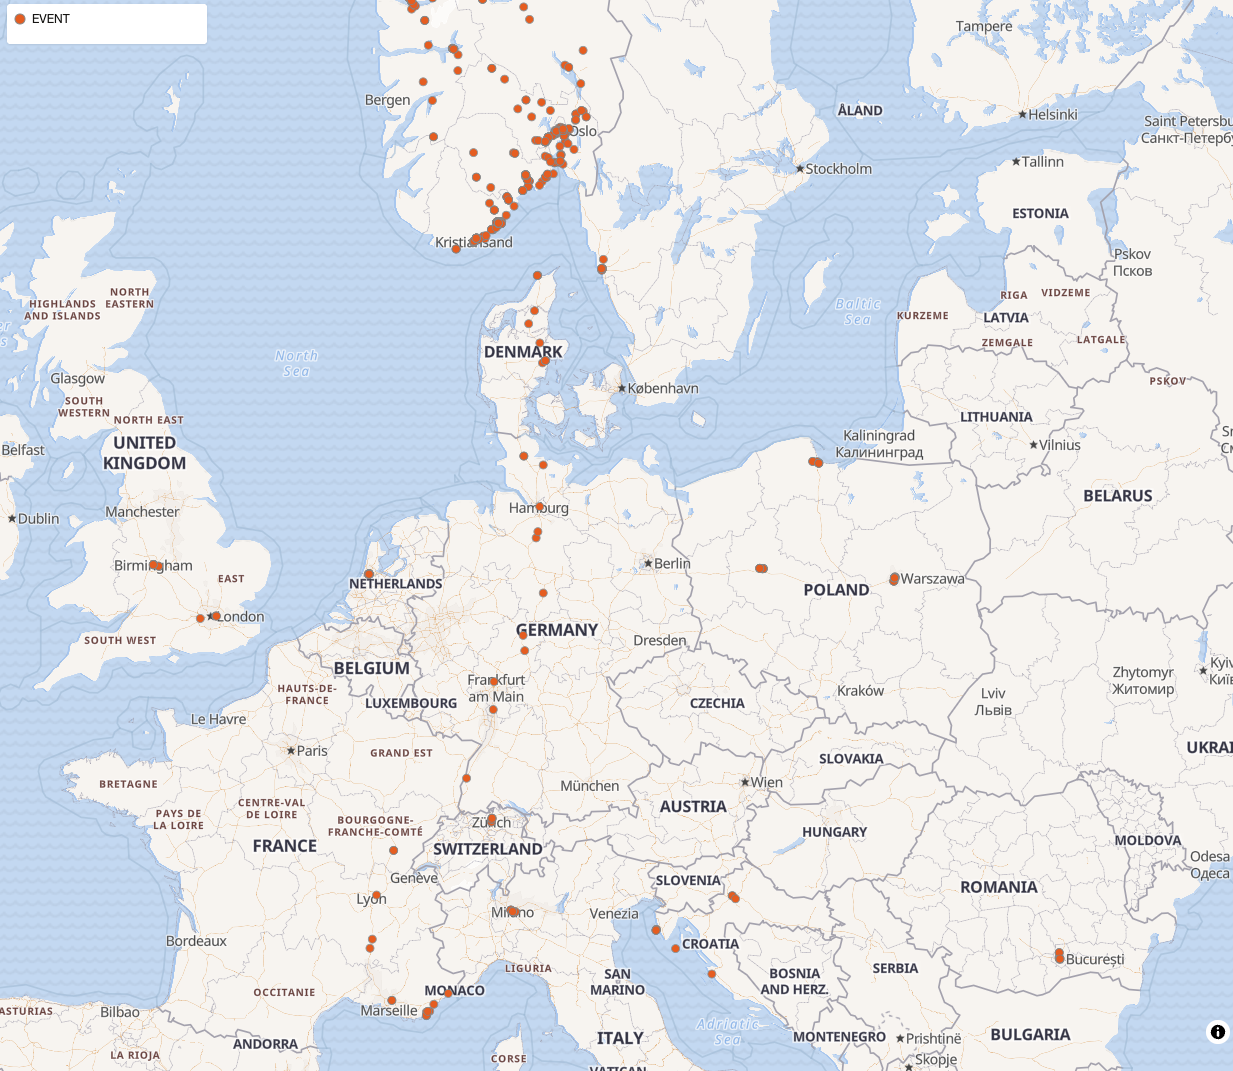
I see some places from last trip to France, lots of stops from charging my car, the rest is mostly conferences outside Norway. POUG, UKOUG, RoOUG, HrOUG, SwissOUC 🤩
That wasn’t really difficult. Showing points on a map is oddly satisfying.
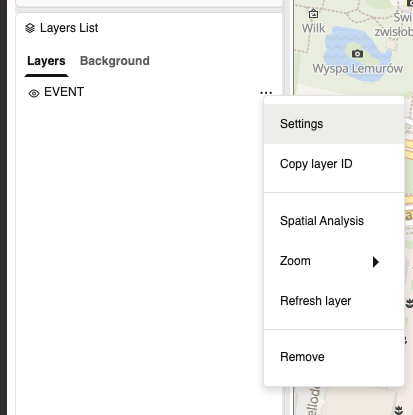
You can change some settings for the layer by clicking on Settings:
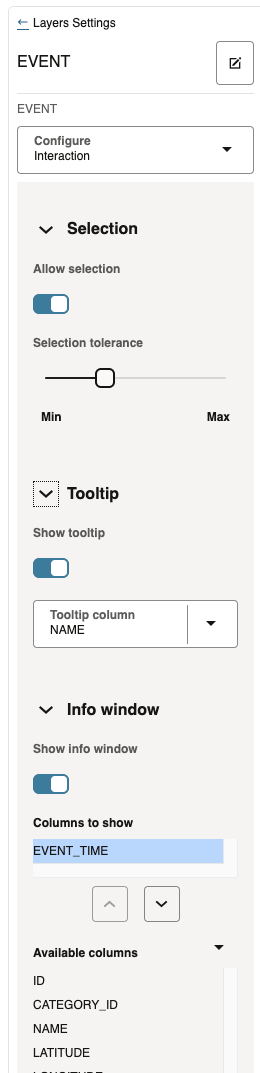
and then add Tooltip and Info window
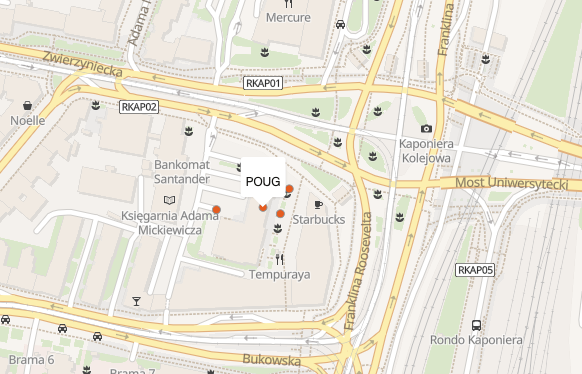
Zoom in and hover the mouse over one of the points to get a tooltip:
Probably the best place in Europe to meet other Oracle nerds:
There is a lot of interesting data out there. Probably the easiest way to get started is to look for data in GeoJSON format. For instance in this Github repository I found all the municipalities (kommuner) and counties (fylker) in Norway in GeoJSON. The largest file for all the municipalities is around 10MB. I uploaded the file from Dataset tab as shown earlier and selecting Local file, add the file and hit the Create button.
After a few seconds of preprocessing I selected the connection where I want to store the table:
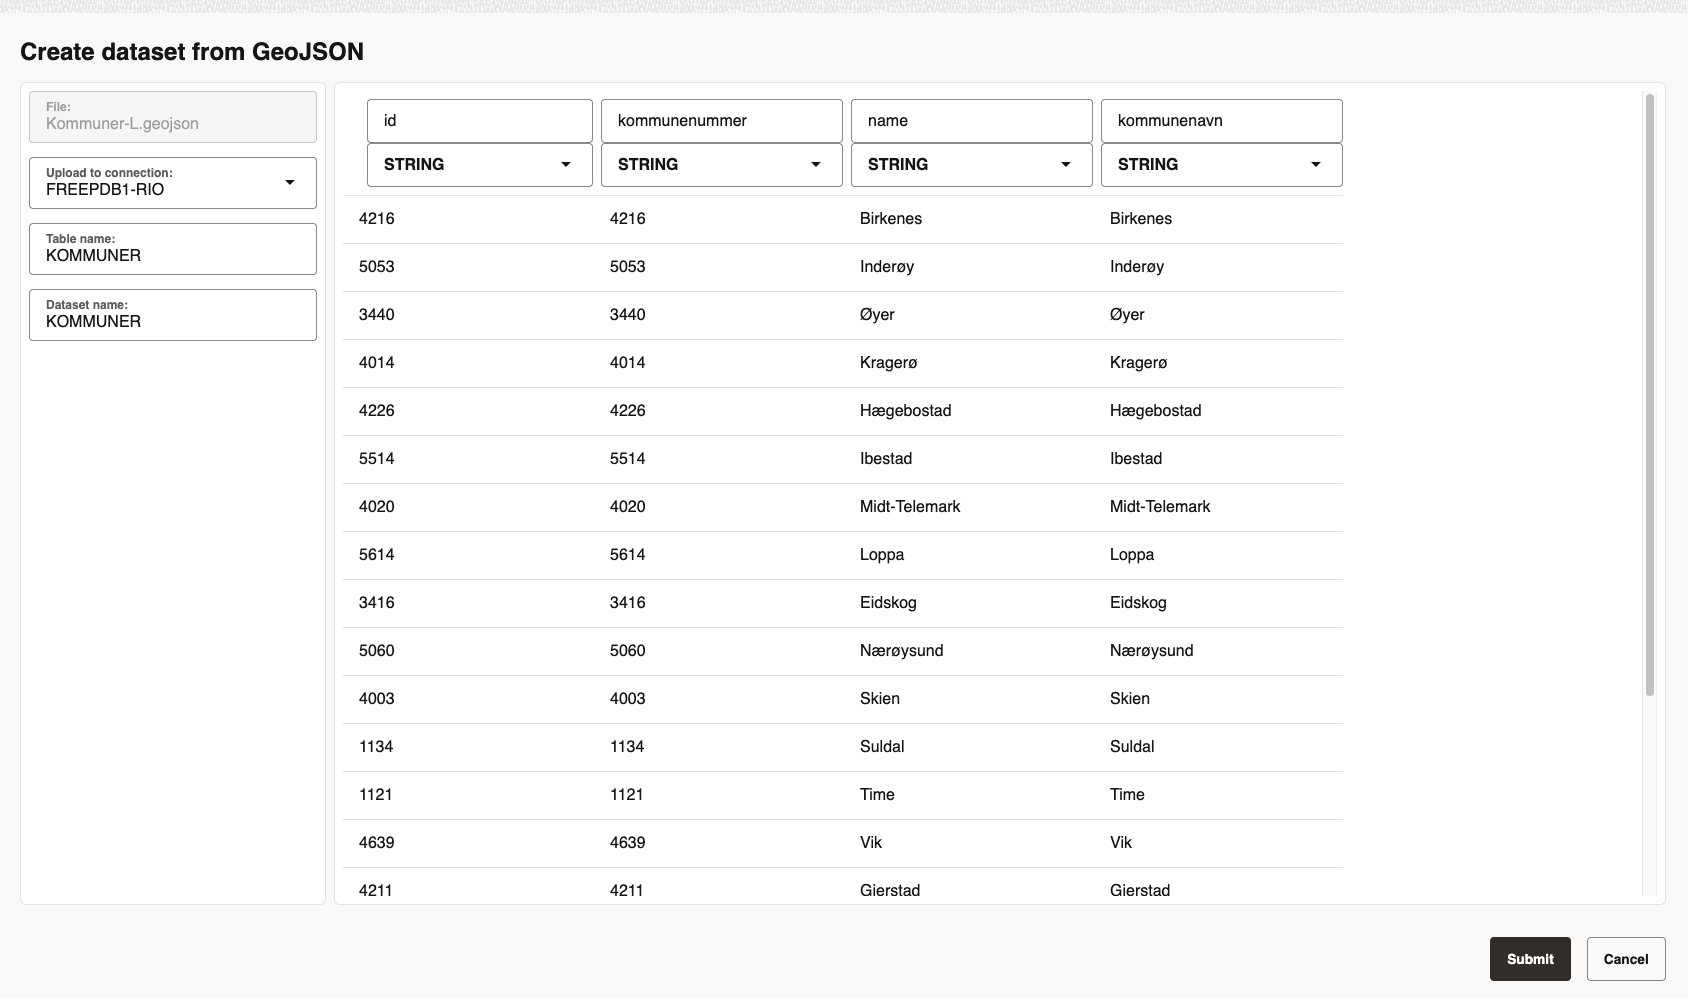
After clicking the Submit-button Spatial Studio starts to upload the file in a background job (useful for large datasets so you don’t have to wait). After a few seconds it appears in the datasets list, but with a yellow warning sign indicating that something needs to be fixed:
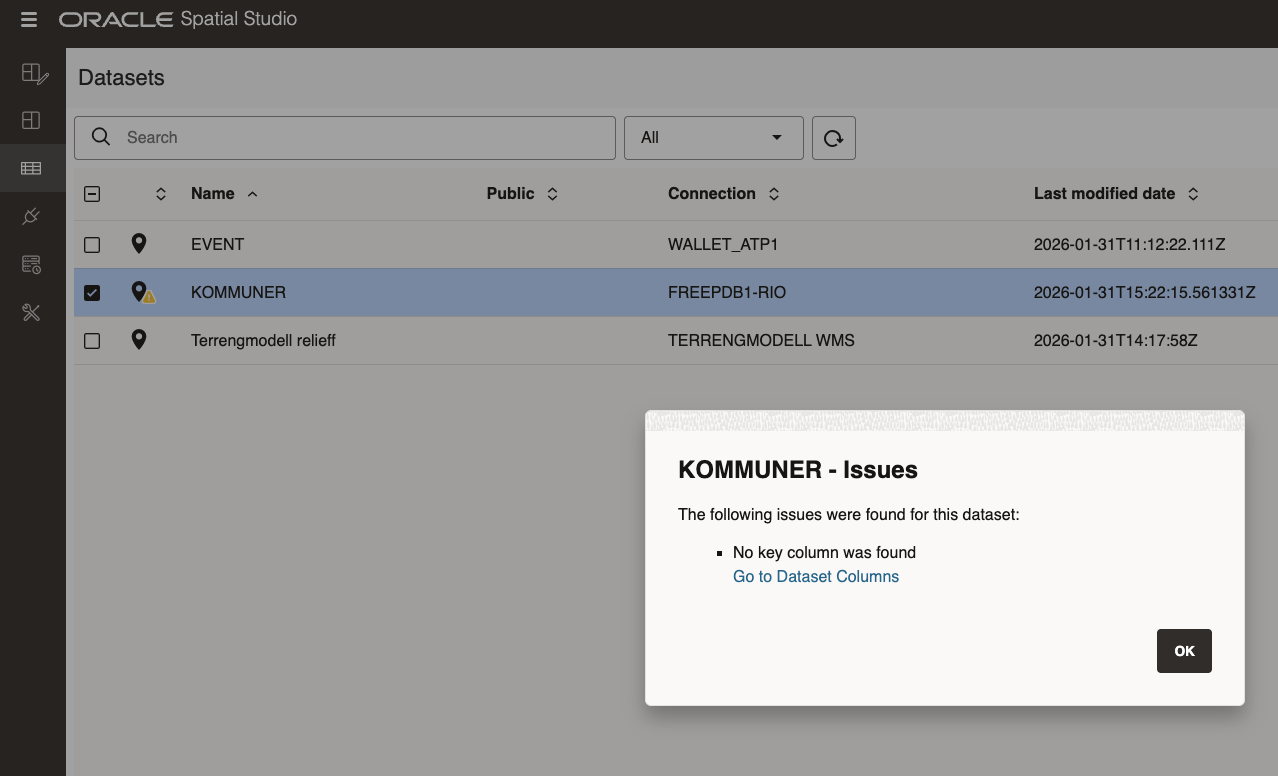
That easy to fix, click the link and select the ID column as key and then validate:
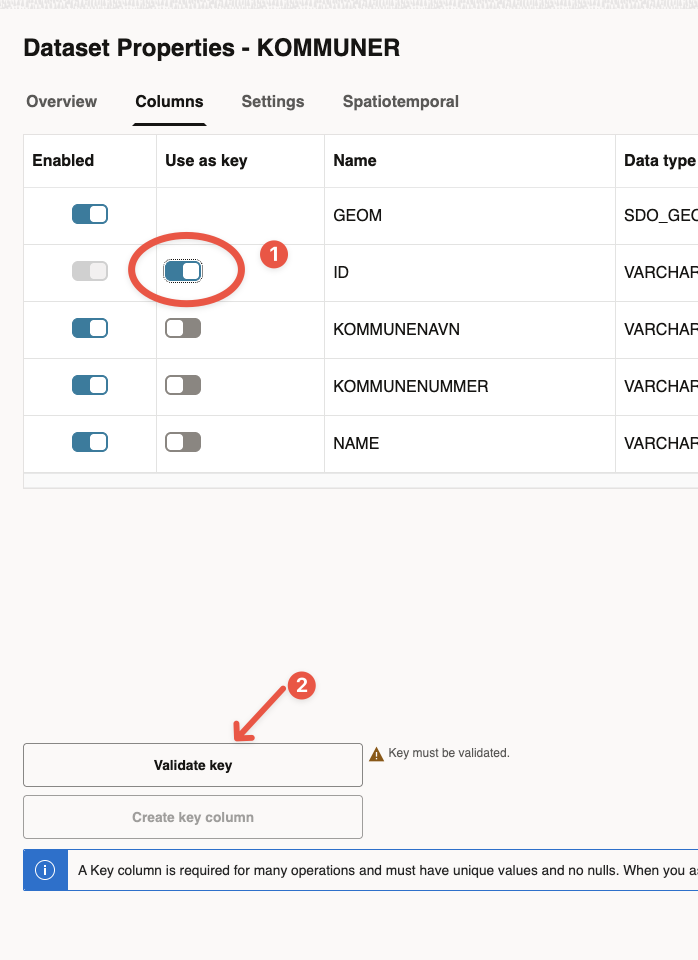
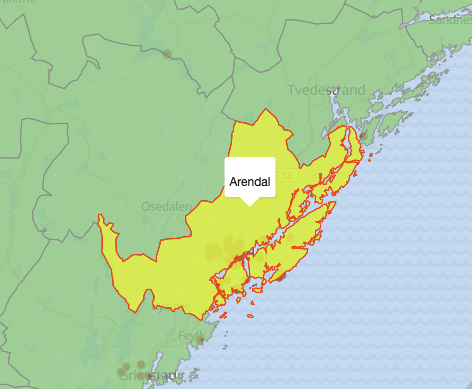
After clicking the Apply-button I verified that Spatial Studio has added an unique index for the ID-column and added a spatial index to the GEOM column. Again, quite some work I don’t have to worry about. This is how my muncipality is rendered after adding it to the project:
With this I hope you understand that Spatial Studio is pretty easy to use and useful to display data on maps. But there are lots of other features to explore, see upcoming posts.
-
You don`t need an extra app for this. You can take a picture with your phone instead and extract the EXIF metadata that will contain position and timestamp. With some Python code and an AI model you can extract features for additional analysis. ↩︎